by Jason Prahl | Jan 8, 2014 | Blog, SQL Server

I have a report that spans multiple pages. There are groupings and page breaks between the groupings. I found that the header rows were not printing on all of the pages of the report.
I found the following instructions for doing it (the first two didn’t work for me but the third one did):
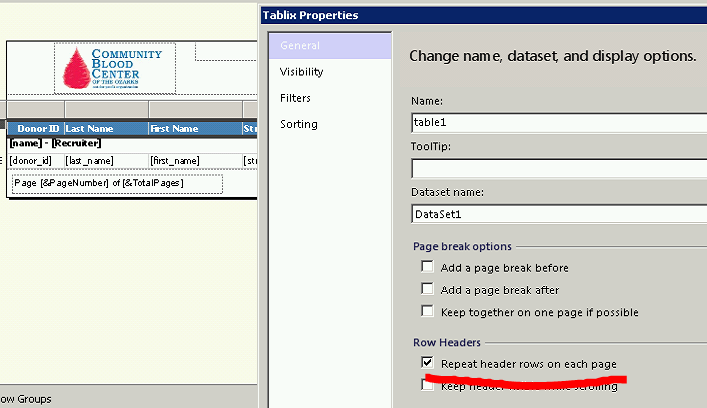
To display row headers on multiple pages
- Right-click the row, column, or corner handle of a tablix data region, and then click Tablix Properties.
- In Row Headers, select Repeat header rows on each page.
- Click OK.
To display column headers on multiple pages
- Right-click the row, column, or corner handle of a tablix data region, and then click Tablix Properties.
- In Column Headers, select Repeat header columns on each page.
- Click OK.
To display a static tablix member (row or column) on multiple pages
- On the design surface, click the row or column handle of the tablix data region to select it. The Grouping pane displays the row and column groups.
- On the right side of the Grouping pane, click the down arrow, and then click Advanced Mode. The Row Groups pane displays the hierarchical static and dynamic members for the row groups hierarchy and the Column groups pane shows a similar display for the column groups hierarchy.
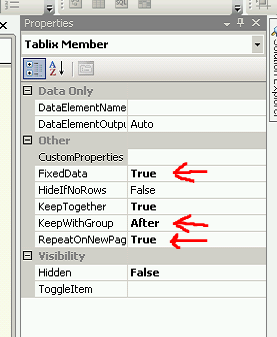
- Click the static member that corresponds to the static member (row or column) that you want to remain visible while scrolling. The Properties pane displays the Tablix Member properties.
- In the Properties pane, set RepeatOnNewPage to True.
- Repeat this for as many adjacent members as you want to repeat.
- Preview the report.
by Jason Prahl | Apr 8, 2013 | Blog, SQL Server

I have a column in a report that calculates a variance between two other columns and displays a percentage.
Some of the columns end up with a zero which would result in a divide by zero error.
So I wrote the following IIF statement that should have handled these situations and just filled in a zero:
=iif(Fields!RBC_Prev_Year.Value=0,0,(Fields!RBC.Value-Fields!RBC_Prev_Year.Value)/Fields!RBC_Prev_Year.Value)
The problem is, well it didn’t work. My report would still end up with an #Error value in the column. After some searching I found the solution on this website.
Essentially even though I was trying to handle the divide by zero issue with the IIF statement reporting services still evaluated each part of the statement before displaying the results which causes the error.
By re-writing it like this:
=iif(Fields!RBC_Prev_Year.Value=0,0,(Fields!RBC.Value-Fields!RBC_Prev_Year.Value)/
iif(Fields!RBC_Prev_Year.Value=0,1,Fields!RBC_Prev_Year.Value))
It works! Weird, but oh well.
by Jason Prahl | Apr 5, 2013 | Blog, SQL Server
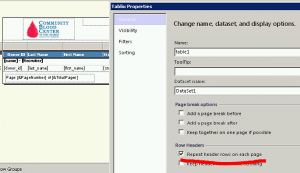
Some things are not as they seem. Like in the Tablix (data table) properties there’s a setting that says “Repeat header rows on each page.” Checking this does not repeat the header rows on each page.
I found some information elsewhere that says you also have to:
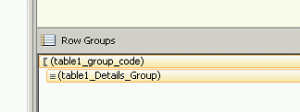
1. In the grouping pane, Go to advanced mode
(click on the small black down arrow on the far right of the grouping pane. A bunch of bars that say Static will show up.)
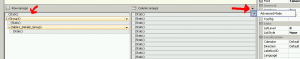
2. Select the corresponding (Static) item in the row group hierarchy. (not the ones in the Column Groups side. For me it was the first one in the Row Groups)
3. In the properties grid, set RepeatOnNewPage to true
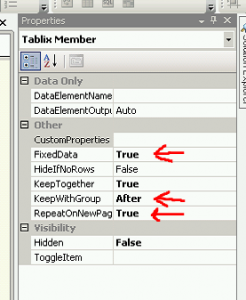
4. KeepwithGroup to After
5. FixedData to True
After doing this my row headers started showing up on all pages. A lot of work for something that seems like should have been taken care of by the first setting.
by Jason Prahl | Feb 15, 2013 | Blog, SQL Server
I have rows from a query such as:
Name Type Quantity
Customer01 A N 5
Customer01 A P 4
Customer01 O N 3
Customer01 O P 2
Customer02 A N 3
Customer02 A P 9
Customer02 O N 5
Customer02 O P 7
So, I can do a grouping and get the total for each customer: (using sum(Fields!Quantity.Value))
Customer01 14
Customer02 24
What I needed is on the report to then show what percentage of the total each line represented.
I finally found that the sum function has a scope you can define to do this.
So I ended up with an expression added to a new column out to the side of the Quantity column on the report that looked like this:
=Fields!Quantity.Value/sum(Fields!Quantity.Value,”table1_group_code”)
The “table1_group_code” is the name of the grouping where I needed the percentage calculated from.
You can find this name in the Row Groups area of the reports designer.
by Jason Prahl | Sep 25, 2012 | Blog, SQL Server
While attempting to setup a linked server in SQL Server 2008 I found that I could not make a connection through an ODBC data source. Everything I was reading showed SQL Server having an ODBC provider right out of the box but it wasn’t in mine. I ran the setup thinking it was a feature I could add and didn’t find it there either. After some poking around I found this page from Microsoft for an OLEDB provider for ODBC called MSDASQL (too many acronyms).
http://www.microsoft.com/en-us/download/details.aspx?id=20065
After downloading the x64 version and installing it I now have “Microsoft OLE DB Provider for ODBC Drivers” as a provider type when creating a new linked server.
I suspect this has something to do with 32bit vs 64bit but haven’t investigated to verify this.
by Jason Prahl | Mar 15, 2012 | Blog, SQL Server
I had an instance where I needed to reset the identity value on a table.
This command will tell you what the next identity value for a table is:
DBCC CHECKIDENT (‘TABLENAME’, NORESEED)
This command will set the next identity value (it sets the value to 1 + the number you enter)
DBCC CHECKIDENT (‘TABLENAME’, RESEED, 0)
I’m not sure what the consequences of doing this on a table that already has records in it.
I imagine you could end up with duplicate values. I was doing this on a table I had emptied first.
by Jason Prahl | Feb 1, 2012 | Blog, SQL Server
I use the instr function in VB all the time and wanted to do something similar in a SQL Server query.
I found that charindex(searchstring,searchfield) does the trick.
by Jason Prahl | Mar 29, 2011 | Blog, SQL Server
This is one I’ve been wanting to figure out for awhile and just never got around to it.
So you have a list like this:
Select email from emaillist
Returns:
email1 @ emailme.com
email2 @ emailme.com
email3 @ emailme.com
email4 @ emailme.com
email5 @ emailme.com
I get a record for each email in the table.
What I want is: email1 @ emailme.com,email2 @ emailme.com,email3 @ emailme.com,email4 @ emailme.com,email5 @ emailme.com,etc.
Here’s SQL I found to do it:
Declare @Description varchar(4000)
select @Description = coalesce(@Description + ‘,’ , ”) + rtrim(email) FROM emaillist
select @Description
You can change the ‘,’ to ‘;’ or any character you want for that matter.
by Jason Prahl | Mar 4, 2011 | Blog, SQL Server
Found this here: http://tiny.cc/p8yk6
Go to Tools, Options, SQL Server Object Explorer, Expand this tree
Choose ‘Commands’ (Note: 0 = everything!)

(This shows the values after I changed them. The default values are 200 for edit and 1000 for select.)
by Jason Prahl | Jul 6, 2010 | Blog, SQL Server
I couldn’t find an easy way to search for a column across all tables in SQL Server 2008 like I could in 2003.
After some poking around on the internet I found the following on this blog:
Select O.name objectName, C.name ColumnName
from sys.columns C inner join sys.objects O ON C.object_id=O.object_id
where C.name like ‘%NameOfColumnHere%’ order by O.name,C.name
Note: Sometimes when you copy and paste the apostrophes get changed surrounding the name of the column you are looking for so you might need to delete them and put them back in.
Update:
The following is for finding stored procedures:
SELECT ROUTINE_NAME, ROUTINE_DEFINITION
FROM INFORMATION_SCHEMA.ROUTINES
WHERE ROUTINE_DEFINITION LIKE ‘%NameOfStoredProcedureHere%’
AND ROUTINE_TYPE=’procedure’