I have rows from a query such as:
Name Type Quantity
Customer01 A N 5
Customer01 A P 4
Customer01 O N 3
Customer01 O P 2
Customer02 A N 3
Customer02 A P 9
Customer02 O N 5
Customer02 O P 7
So, I can do a grouping and get the total for each customer: (using sum(Fields!Quantity.Value))
Customer01 14
Customer02 24
What I needed is on the report to then show what percentage of the total each line represented.
I finally found that the sum function has a scope you can define to do this.
So I ended up with an expression added to a new column out to the side of the Quantity column on the report that looked like this:
=Fields!Quantity.Value/sum(Fields!Quantity.Value,”table1_group_code”)
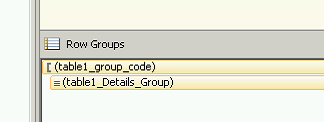
The “table1_group_code” is the name of the grouping where I needed the percentage calculated from.
You can find this name in the Row Groups area of the reports designer.